- Paper: Modeling Tabular Data using Conditional GAN
- Presenter: Hongsup
- Attendees: Brian, Kate
Why this paper?
At work, I train models using tabular data with extreme class imbalance, which is often quite challenging. To tackle this, I have been looking into data augmentation techniques for tabular data, which is a relatively understudied domain compared to unstructured data. Synthetic Data Vault is a popular python library for tabular data synthesis, and the main techniques originate from the paper above. Since class imbalance is a common problem in real-world data and most of us work with tabular data, I think this will be an interesting paper to discuss.
Paper summary
Several challenges lie in tabular data synthesis. They often have mixed data types with non-Gaussian or multi-modal distributions. Categorical variables in a tabular dataset often have severe class imbalance and provide insufficient samples. The authors argue that GAN’s flexibility can address these problems. The authors introduce several techniques for their approach, conditional-tabular GAN (CT-GAN).
Mode-specific normalization
The basic idea is mode-specific normalization is to convert a continuous-variable column into a set of columns where each column represents an estimated mode (like an indicator) and its value represents the weight of the corresponding mode. To estimate the number of the modes, they use variational Gaussian mixture (VGM) method.
Conditional generator and training-by-sampling
Traditional GANs have Gaussian assumption where a vector is sampled from a standard multivariate normal distribution. However, this doesn’t account for class imbalance, which is a problem in tabular data. So the goal here is to resample data so that all categories are sampled evenly during training, and to estimate the conditional distribution of rows given that particular value at that particular column.
CT-GAN model
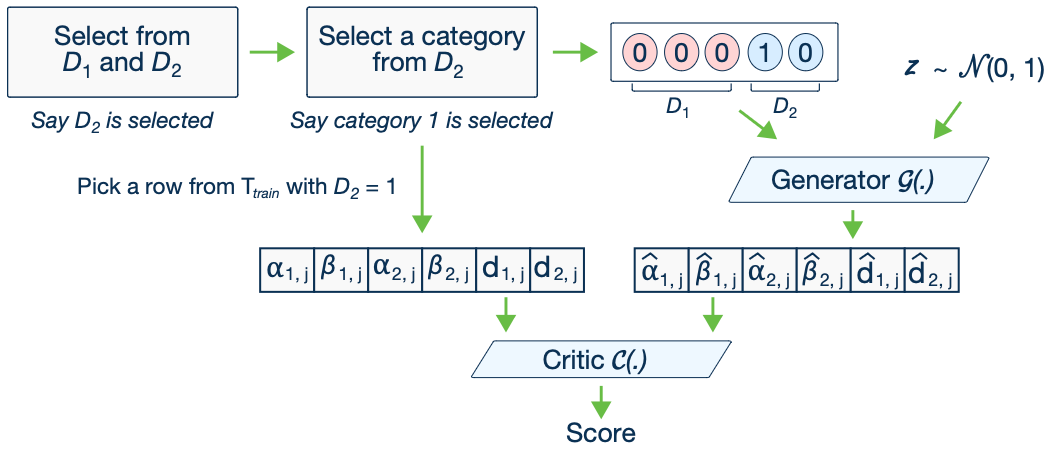
In the CT-GAN model, the data are represented Conditional vector where each discrete column is a one-hot vector. The mask vector is used to only represent a category of a single discrete column (in one-hot way, the rest is all zero). The generator loss is cross-entropy between \(m_{i^*}\) (given by data) and \(\hat{d}_{i^*}\) (produced by the generator) averaged over all rows in a batch. During the critic assessment stage, the model measures distance between learned conditional distribution and conditional distribution on real data while exploring all possible values evenly.
Model evaluation
Baseline models
The paper uses multiple baseline models for performance comparison. They use two Bayesian network models (CLBN and PrivBN), other GAN models (MedGAN, VeeGAN, TableGAN), and a tabular VAE (TVAE) model that they built. The TVAE model has multivariate Gaussian assumption.
Evaluation metrics
For model comparison, the authors use two metrics. Likelihood fitness metric which estimates how well the synthetic data can fit the data oracle well. They also use ML efficacy, which measures whether ML model performance from synthetic data is comparable to that from using real data.
Results
For model comparison, they used several different sets of data. First, they used multi-modal Gaussian-simulated data. Here, other GANs suffer from model collapse and the CT-GAN showed better performance. When simulated data from Bayesian networks were used, the Bayesian baseline models (CLBN and PrivBN) performed the best. With real-world data, TVAE and CTGAN performed the best although TVAE was often better.
Discussion
Even though we were pleased to see good baseline comparison with multiple different datasets, we thought the authors should have did more thorough work on literature review such as comparing their work with synthpop, a widely-used data synthesis package in R. They also could have looked into other statistical models because data synthesis an active research area in statistics.
We also questioned the validity of the VGM technique because it is the core of creating the embedding of continuous variables. The proposed model does not have checks that evaluate the fidelity of VGM estimation, and thus poor estimation of a multi-model distribution by it can further compromise model performance in general.
We also thought their claim on CT-GAN was a bit exaggerated. First, in most benchmark datasets, it was actually TVAE model that performed the best. In the performance comparison table, there was only one regression data, which we thought insufficient to evaluate the ML efficacy metric the authors proposed. Finally, the proposed models for the regression problem showed negative R scores, suggesting that the models performed quite poorly.
Overall, we thought the approach was novel but the evaluation could have been improved given that tabular datasets are quite diverse. Also, given that GAN is expensive train, we would have liked to learn more practical aspects of the implementation.
If you found this post useful, you can cite it as:
@article{
    austinmljc-2024-tabular-gan,
    author = {Hongsup Shin},
    title = {Modeling Tabular Data using Conditional GAN},
    year = {2024},
    month = {05},
    day = {30},
    howpublished = {rl{https://austinmljournalclub.github.io}},
    journal = {Austin ML Journal Club},
    url = {https://austinmljournalclub.github.io/posts/20240530/},
}